
Introduction
I successfully completed Google Summer of Code with Prometheus in the summer of 2018. I was mentored by Goutham Veeramachaneni
I did 3 independant addition/fixes as a part of my GSoC. All related to rules/alerting rules. Apart from my proposal, I also fixed some bugs in prometheus/tsdb during GSoC period.
Fixes
1) Persist for State of Alerts
Prometheus had 1 serious long standing issue, where, if the Prometheus server crashes, the state of the alert is lost.
Consider that you have an alert with for duration as 24hrs, and Prometheus crashed while that alert has been active for 23hrs, i.e. 1hr before it would fire. Now when Prometheus is started again, it would have to wait for 24hrs again before firing!
Features
2) Unit Testing for Rules
Alerting is an important feature in monitoring when it comes to maintaining site reliability, and Prometheus is being used widely for this. We also record many rules to visualise later. Hence it becomes very important to be able to check the correctness of the rules.
In this feature, I added the support of unit testing for both alerting and recording rules.
3) UI for Testing Alerting Rules
As you saw above how important alerting rules are for monitoring, Prometheus also lacks any good and convenient way of visualising and testing the alert rules before it can be used.
In this feature I add a UI for entering your alerting rules and testing+visualising it on the real data that is there in your server.
Epilogue
This work would not have been possible without valuable inputs and reviews by Brian Brazil and Julius Volz
I gave a lightning talk at PromCon 2018 regarding all that you read above. It was held in Munich, Germany.
1) Persist for State of Alerts
Introduction
This happens to be the first issue I fixed during my GSoC. You can find the PR#4061 here, which is already merged into Prometheus master and is available from v2.4.0 onwards.
This post assumes that you have a basic understanding of what monitoring is and how alerting is related to it. If you are new to this world, this post should help you get started.
Issue
To talk about alerting in Prometheus in layman terms, an alerting rule consists of a condition, for duration, and a blackbox to handle the alert.
So the simple trick here is, if the condition is true for for duration amount of time, we trigger an alert (called as 'firing' of alert) and give it to the blackbox to handle it in the way it wants, which can be sending a mail, message in slack, etc.
As discussed here, consider that you have an alert with for duration as 24hrs, and Prometheus crashed while that alert has been active (condition is true) for 23hrs, i.e. 1hr before it would fire. Now when Prometheus is started again, it would have to wait for 24hrs again before firing!
You can find the GitHub issue #422 here
The Fix
Use time series to store the state! The procedure is something like this:
- During every evaluation of alerting rules, we record the
ActiveAt(when didconditionbecometruefor the first time) of ever alert in a time series with nameALERTS_FOR_STATE, with all the labels of that alert. This is like any other time series, but only stored in local. - When Prometheus is restarted, a job runs for restoring the state of alerts after the second evaluation. We wait till the second evaluation so that we have enough data scraped to know the current active alerts.
- For each alert which is active right now, the job looks for its corresponding
ALERTS_FOR_STATEtime series. The timestamp and the value of the last sample of the series gives us the info about when did Prometheus went down and when was the alert last active at. - So if the
forduration was sayD, alert became active atXand Prometheus crashed atY, then the alert has to wait for moreD-(Y-X)duration (Why? Think!). So variables of the alert are adjusted to make it wait for moreD-(Y-X)time before firing, and notD.
Things to keep in mind
rules.alert.for-outage-tolerance | default=1h
This flag specifies how long Prometheus will be tolerant on downtime. So if Prometheus has been down longer than the time set in this flag, then the state of the alerts are not restored. So make sure to either change the value of flag depending on your need or get Prometheus up soon!
rules.alert.for-grace-period | default=10m
We would not like to fire an alert just after Prometheus is up. So we introduce something called "grace period", where if D-(Y-X) happens to be less than rules.alert.for-grace-period, then we wait for the grace period duration before firing the alert.
Note: We follow this logic only if the for duration was itself ≥ rules.alert.for-grace-period.
Gotchas
As the ALERTS_FOR_STATE series is stored in local storage, if you happen to lose the local TSDB data while Prometheus is down, then you lose the state of the alert permanently.
2) Unit Testing for Rules
Introduction
It is always good to do 1 last check of all the components of your code before you deploy it. We have seen how important alerting and recording is in the monitoring world. So why not test even the alerting and recording rules?
This was proposed long back in this GitHub issue #1695, and I worked on this during my GSoC. The work can be found in this PR#4350, which has been merged with Prometheus master.
Syntax
We use a separate file for specifying unit tests for alerting rules and PromQL expressions (in place of recording rules). This syntax of the file is based on this design doc which was constantly reviewed by Prometheus members.
Edit: This blog post will not be updated with any changes to unit testing. It might get outdated in future, hence also have a look at official documentation here.
The File
# This is a list of rule files to consider for testing.
rule_files:
  [ - <file_name> ]

# optional, default = 1m
evaluation_interval: <duration>

# The order in which group names are listed below will be the order of evaluation of
# rule groups (at a given evaluation time). The order is guaranteed only for the groups mentioned below.
# All the groups need not be mentioned below.
group_eval_order:
  [ - <group_name> ]

# All the test are listed here.
tests:
  [ - <test_group> ]
<test_group>
# Series data
interval: <duration>
input_series:
  [ - <series> ]

# Unit tests for the above data.

# Unit tests for alerting rules. We consider the alerting rules from the input file.
alert_rule_test:
  [ - <alert_test_case> ]

# Unit tests PromQL expressions.
promql_expr_test:
  [ - <promql_test_case> ]
<series>
# This follows the series notation (x{a="b", c="d"}). You can see an example below.
series: <string>

# This uses expanding notation. Example below.
values: <string>
<alert_test_case>
Prometheus allows you to have same alertname for different alerting rules. Hence in this unit testing, you have to list the union of all the firing alerts for the alertname under a single <alert_test_case>.
# It's the time elapsed from time=0s when the alerts have to be checked.
eval_time: <duration>

# Name of the alert to be tested.
alertname: <string>

# List of expected alerts which are firing under the given alertname at
# given evaluation time. If you want to test if an alerting rule should
# not be firing, then you can mention the above fields and leave 'exp_alerts' empty.
exp_alerts:
  [ - <alert> ]
<alert>
Remember, this alert shoud be firing.
# These are the expanded labels and annotations of the expected alert.
# Note: labels also include the labels of the sample associated with the
# alert (same as what you see in `/alerts`, without series `__name__` and `alertname`)
exp_labels:
  [ <labelname>: <string> ]
exp_annotations:
  [ <labelname>: <string> ]
<promql_test_case>
# Expression to evaluate
expr: <string>

# It's the time elapsed from time=0s when the alerts have to be checked.
eval_time: <duration>

# Expected samples at the given evaluation time.
exp_samples:
  [ - <sample> ]
<sample>
# Labels of the sample in series notation.
labels: <series_notation>

# The expected value of the promql expression.
value: <number>
Example
This is an example input files for unit testing which passes the test. alerts.yml contains the alerting rule, tests.yml follows the syntax above.
alerts.yml
# This is the rules file.

groups:
- name: example
  rules:

  - alert: InstanceDown
    expr: up == 0
    for: 5m
    labels:
        severity: page
    annotations:
        summary: "Instance {{ $labels.instance }} down"
        description: "{{ $labels.instance }} of job {{ $labels.job }} has been down for more than 5 minutes."

  - alert: AnotherInstanceDown
    expr: up == 0
    for: 10m
    labels:
        severity: page
    annotations:
        summary: "Instance {{ $labels.instance }} down"
        description: "{{ $labels.instance }} of job {{ $labels.job }} has been down for more than 5 minutes."`</pre>
test.yml
# This is the main input for unit testing.
# Only this file is passed as command line argument.

rule_files:
    - alerts.yml

evaluation_interval: 1m

tests:
 # Test 1.
    - interval: 1m
  # Series data.
      input_series:
          - series: 'up{job="prometheus", instance="localhost:9090"}'
            values: '0 0 0 0 0 0 0 0 0 0 0 0 0 0 0'
          - series: 'up{job="node_exporter", instance="localhost:9100"}'
            values: '1 1 1 1 1 1 1 0 0 0 0 0 0 0 0'
          - series: 'go_goroutines{job="prometheus", instance="localhost:9090"}'
            values: '10+10x2 30+20x5'
          - series: 'go_goroutines{job="node_exporter", instance="localhost:9100"}'
            values: '10+10x7 10+30x4'

 # Unit test for alerting rules.
    alert_rule_test:
    # Unit test 1.
        - eval_time: 10m
          alertname: InstanceDown
          exp_alerts:
      # Alert 1.
              - exp_labels:
                    severity: page
                    instance: localhost:9090
                    job: prometheus
                exp_annotations:
                    summary: "Instance localhost:9090 down"
                    description: "localhost:9090 of job prometheus has been down for more than 5 minutes."
 # Unit tests for promql expressions.
    promql_expr_test:
    # Unit test 1.
        - expr: go_goroutines > 5
          eval_time: 4m
          exp_samples:
      # Sample 1.
              - labels: 'go_goroutines{job="prometheus",instance="localhost:9090"}'
                value: 50
      # Sample 2.
              - labels: 'go_goroutines{job="node_exporter",instance="localhost:9100"}'
                value: 50
Usage
This feature will come embedded in promtool.
# For the above example.
./promtool test rules test.yml

# If you have multiple such test files, say test{1,2,3}.yml
./promtool test rules test1.yml test2.yml test3.yml
What is tested?
- Syntax of the rule files included in the test.
- Correcness of template variables. Note that, if you have used
$labels.something_wrong, it wont be caught at this stage. - If the alerts listed for the alertname are exactly same as what we get after simulation over the data.
- Exact match for the samples returned by PromQL expressions at given time. Order doesn't matter.
While we do the matches in 3 and 4, usage of $labels.something_wrong will be caught as it will result in an empty string.
3) UI for Testing Alerting Rules
Introduction
Before this work, Prometheus lacked any good and convenient way of visualising and testing the alert rules before it can be used. Requests for the same have been made long ago in these issues #1154 1220, long standing!
It will be added to Prometheus with this PR#4277. Now let's learn more about this.
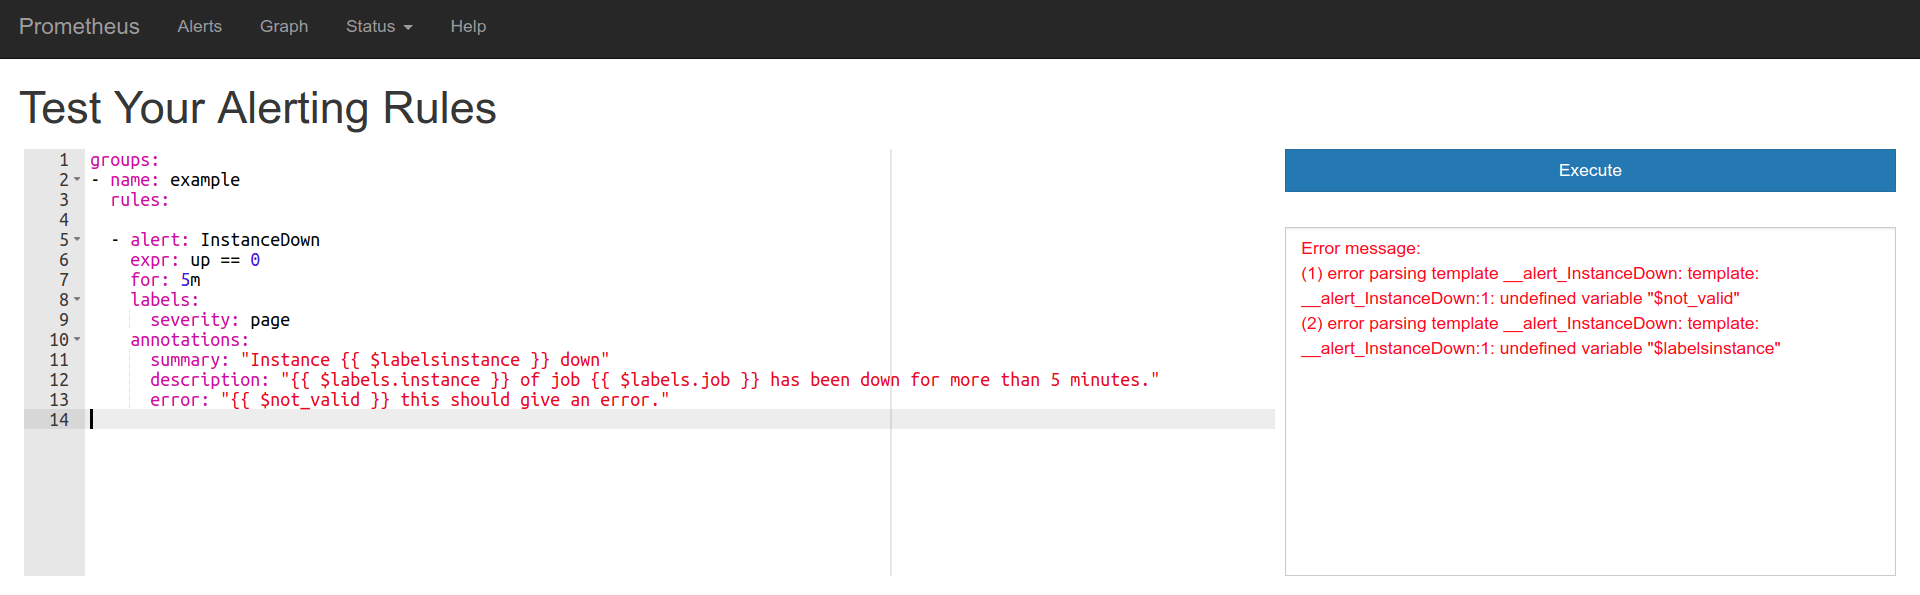
The UI
You will be able to access this tool at /alert-rule-testing.
open images in new tab for a better view
This is what you will see when you first open.
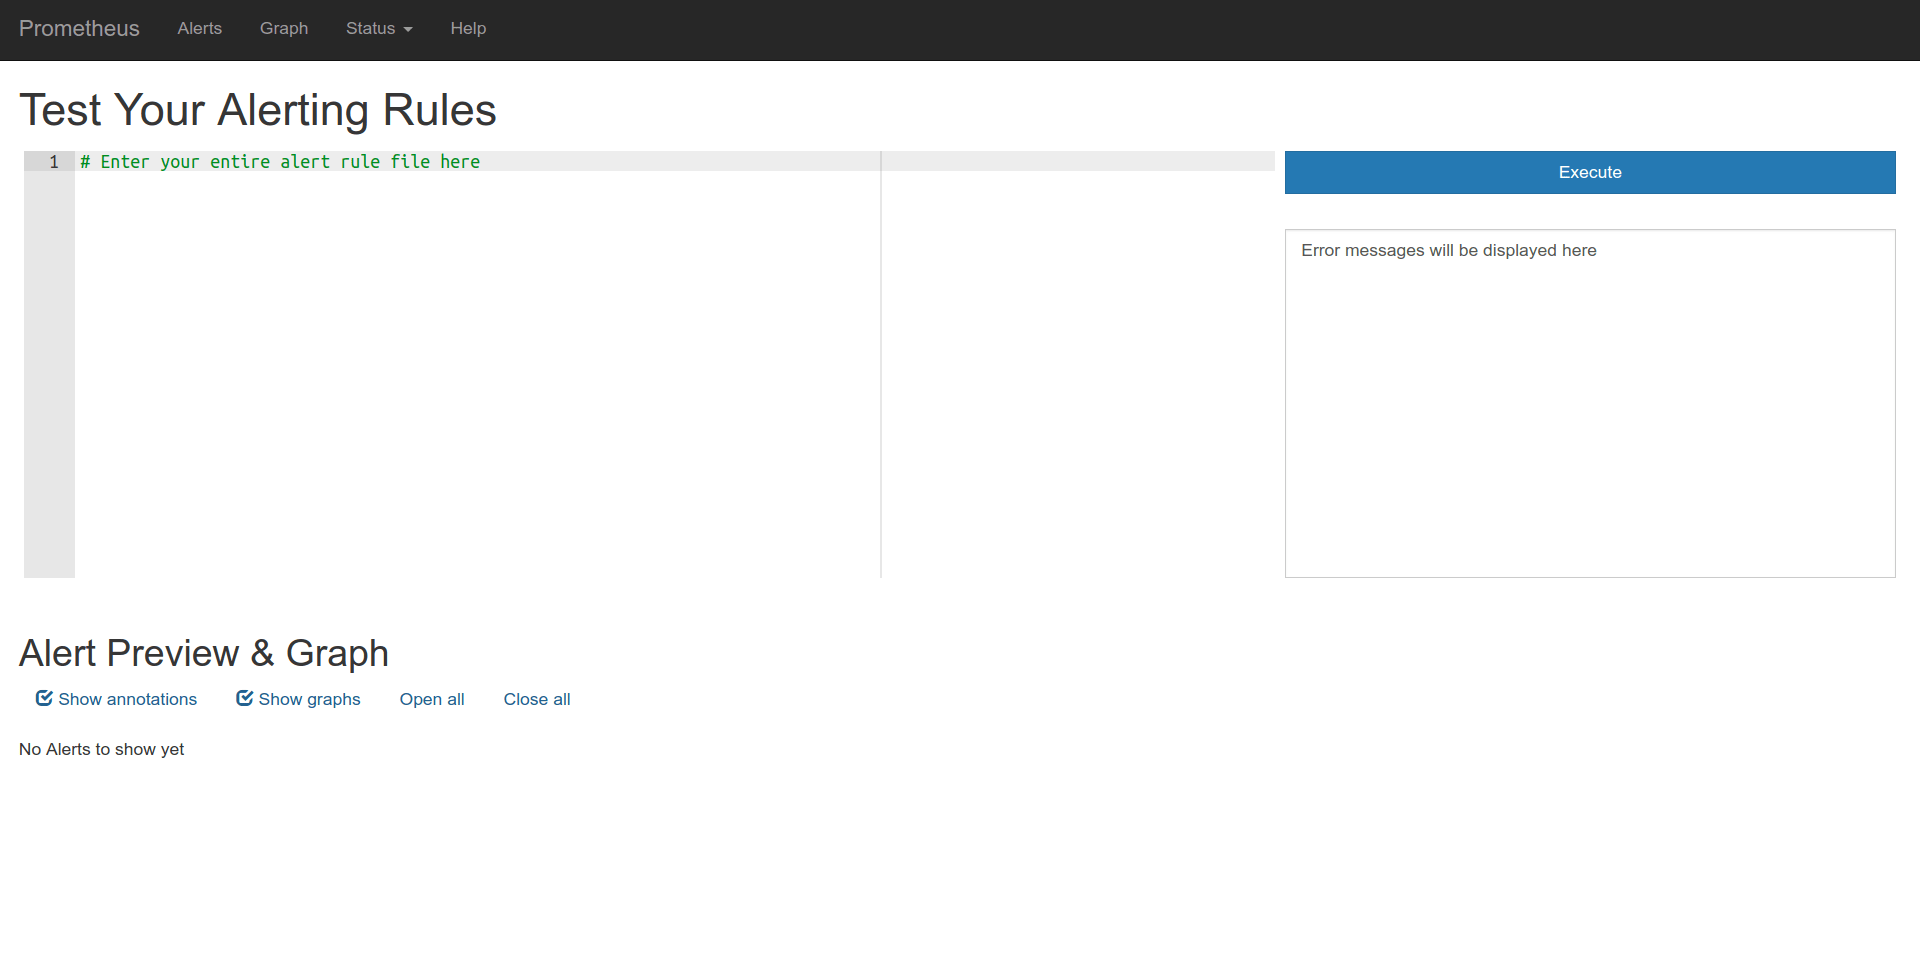
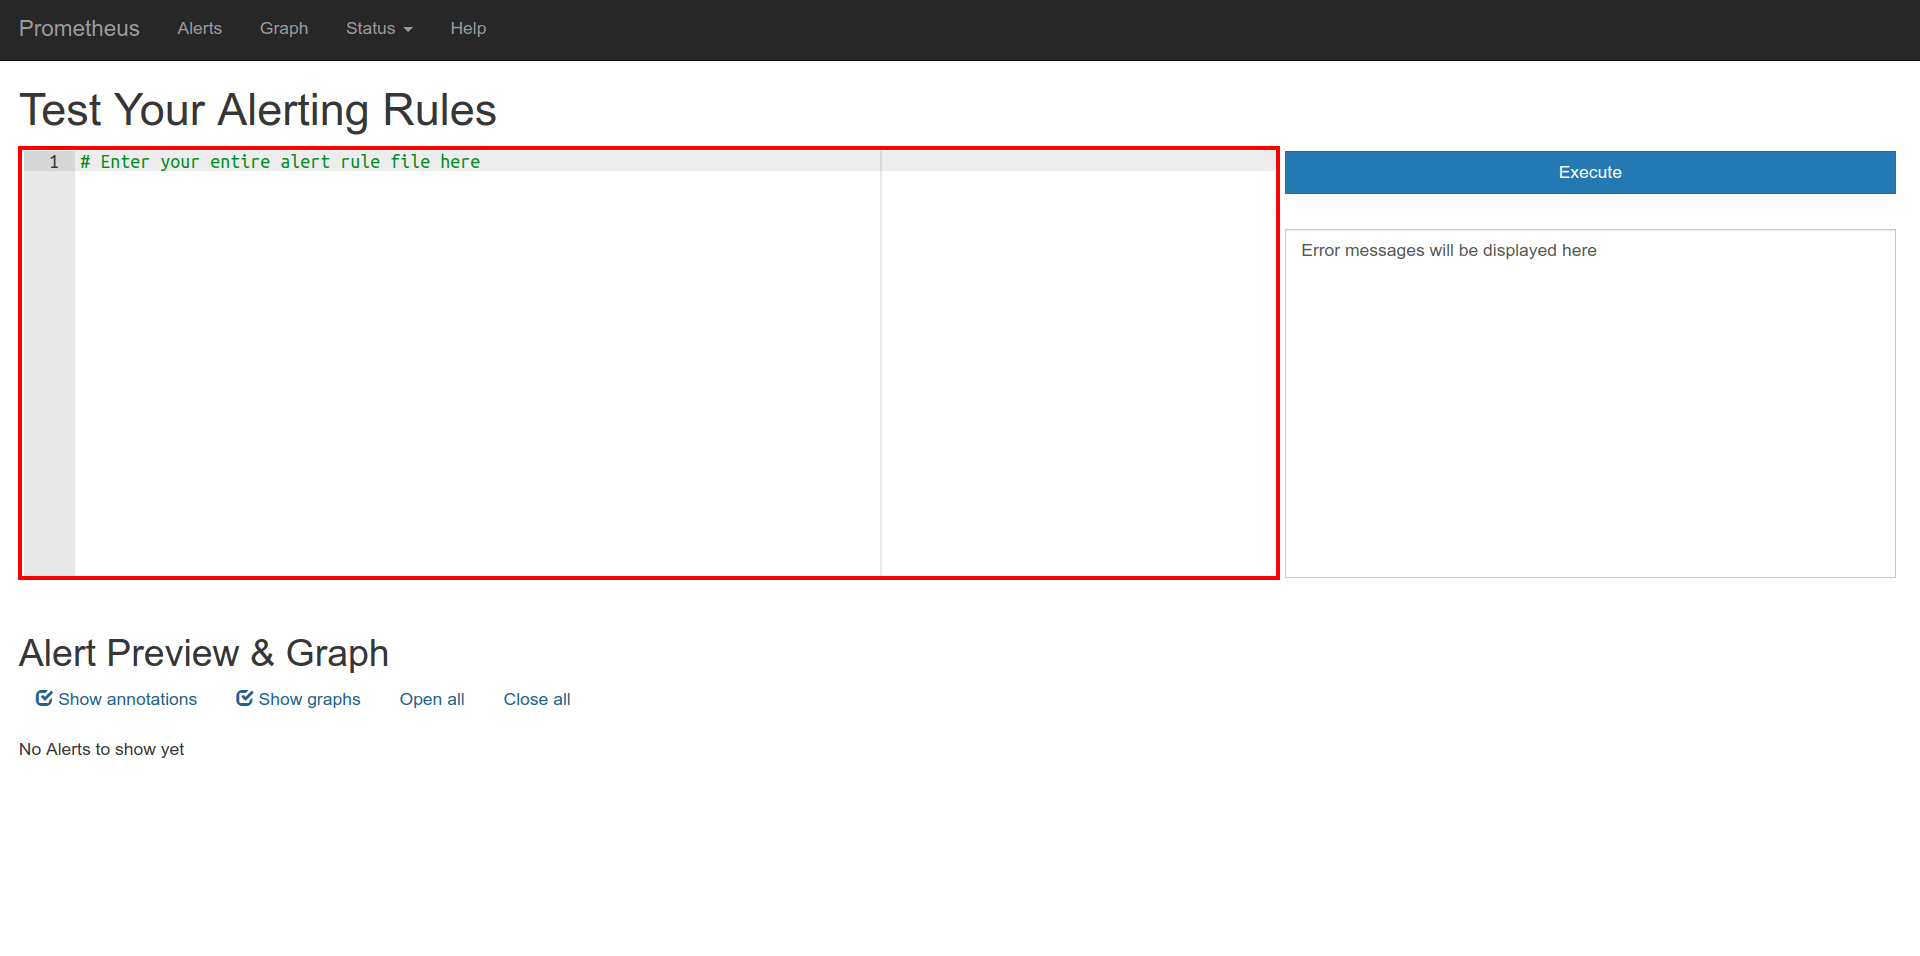
You will enter your rules here in the same format as your would write your rule file.
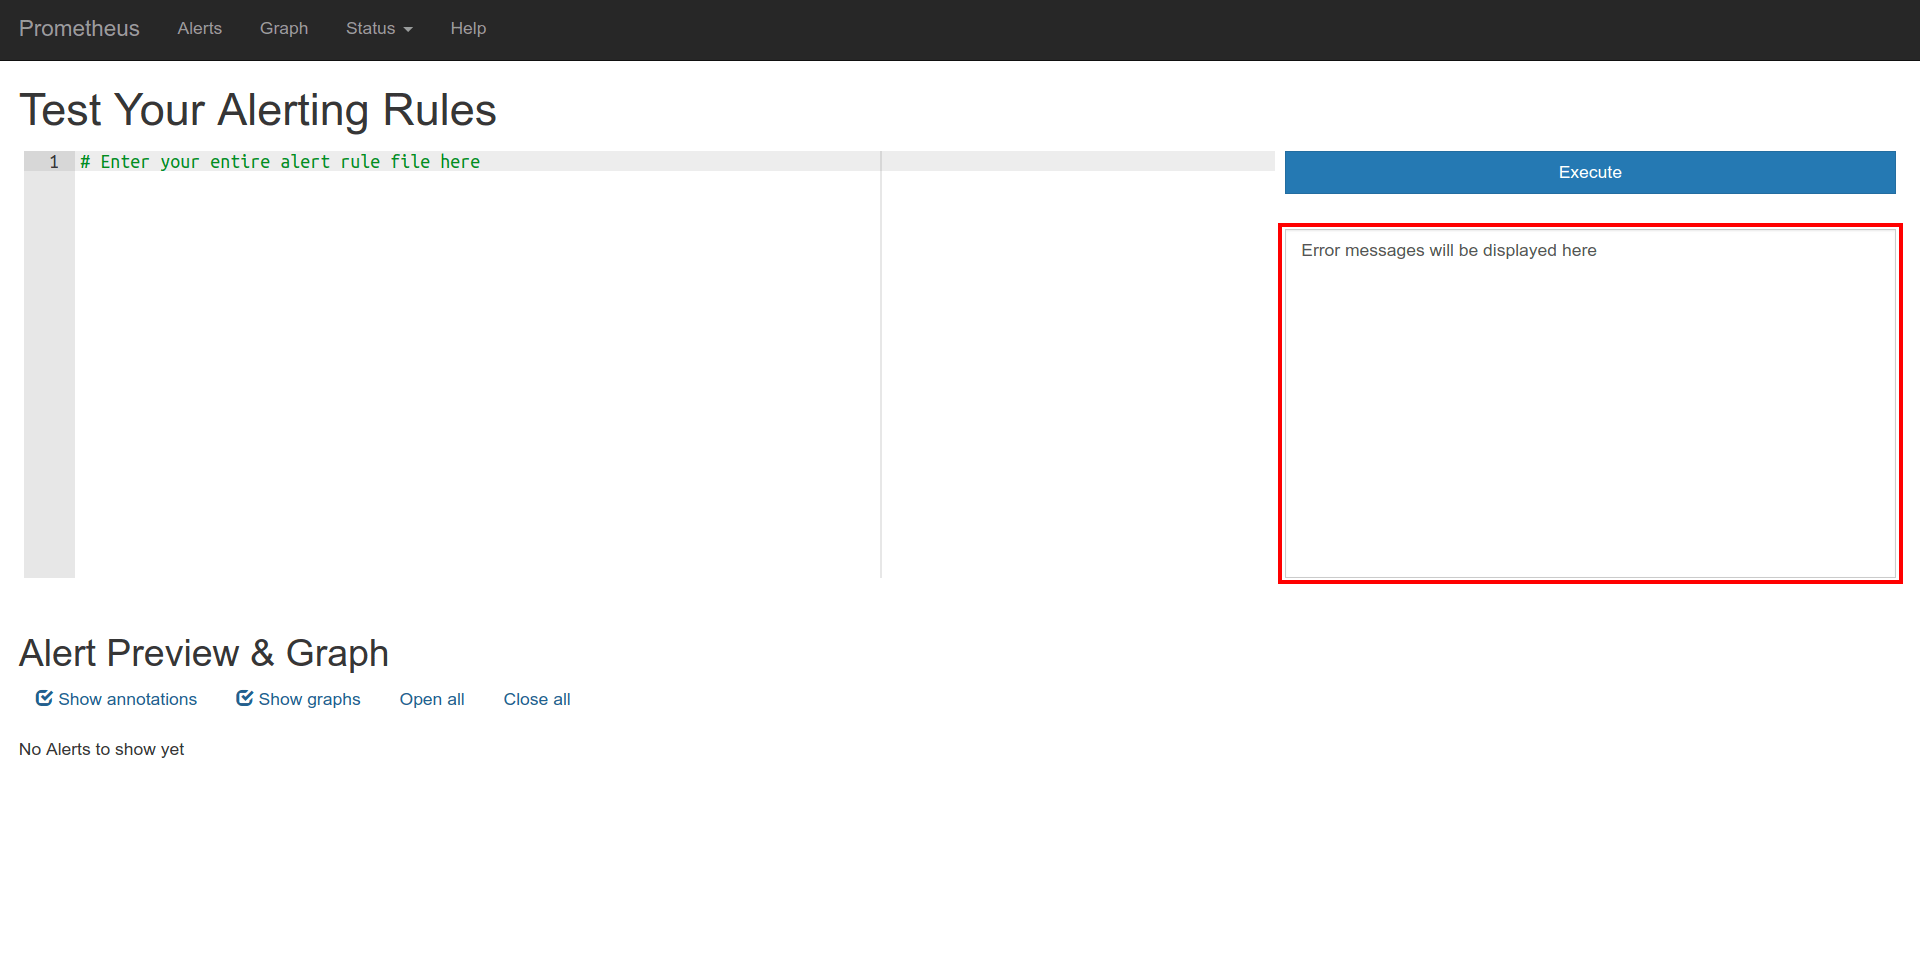
After you press Execute, you will see success/error messages here.
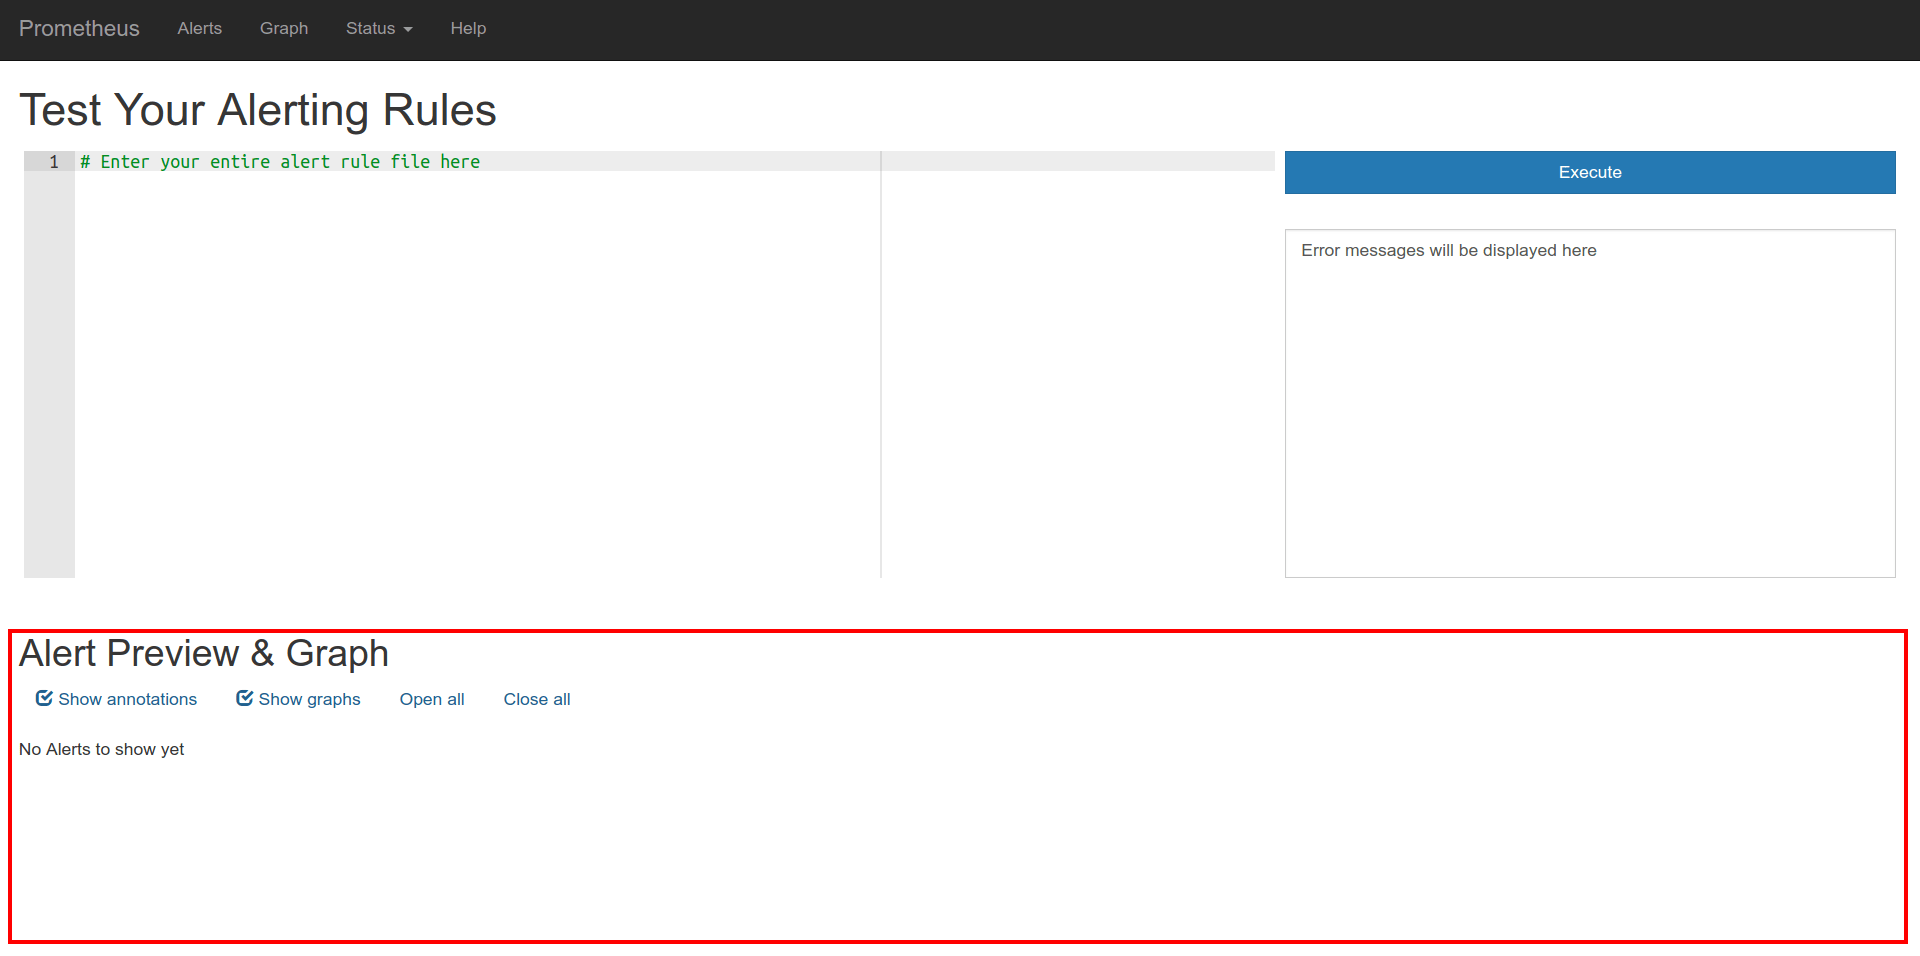
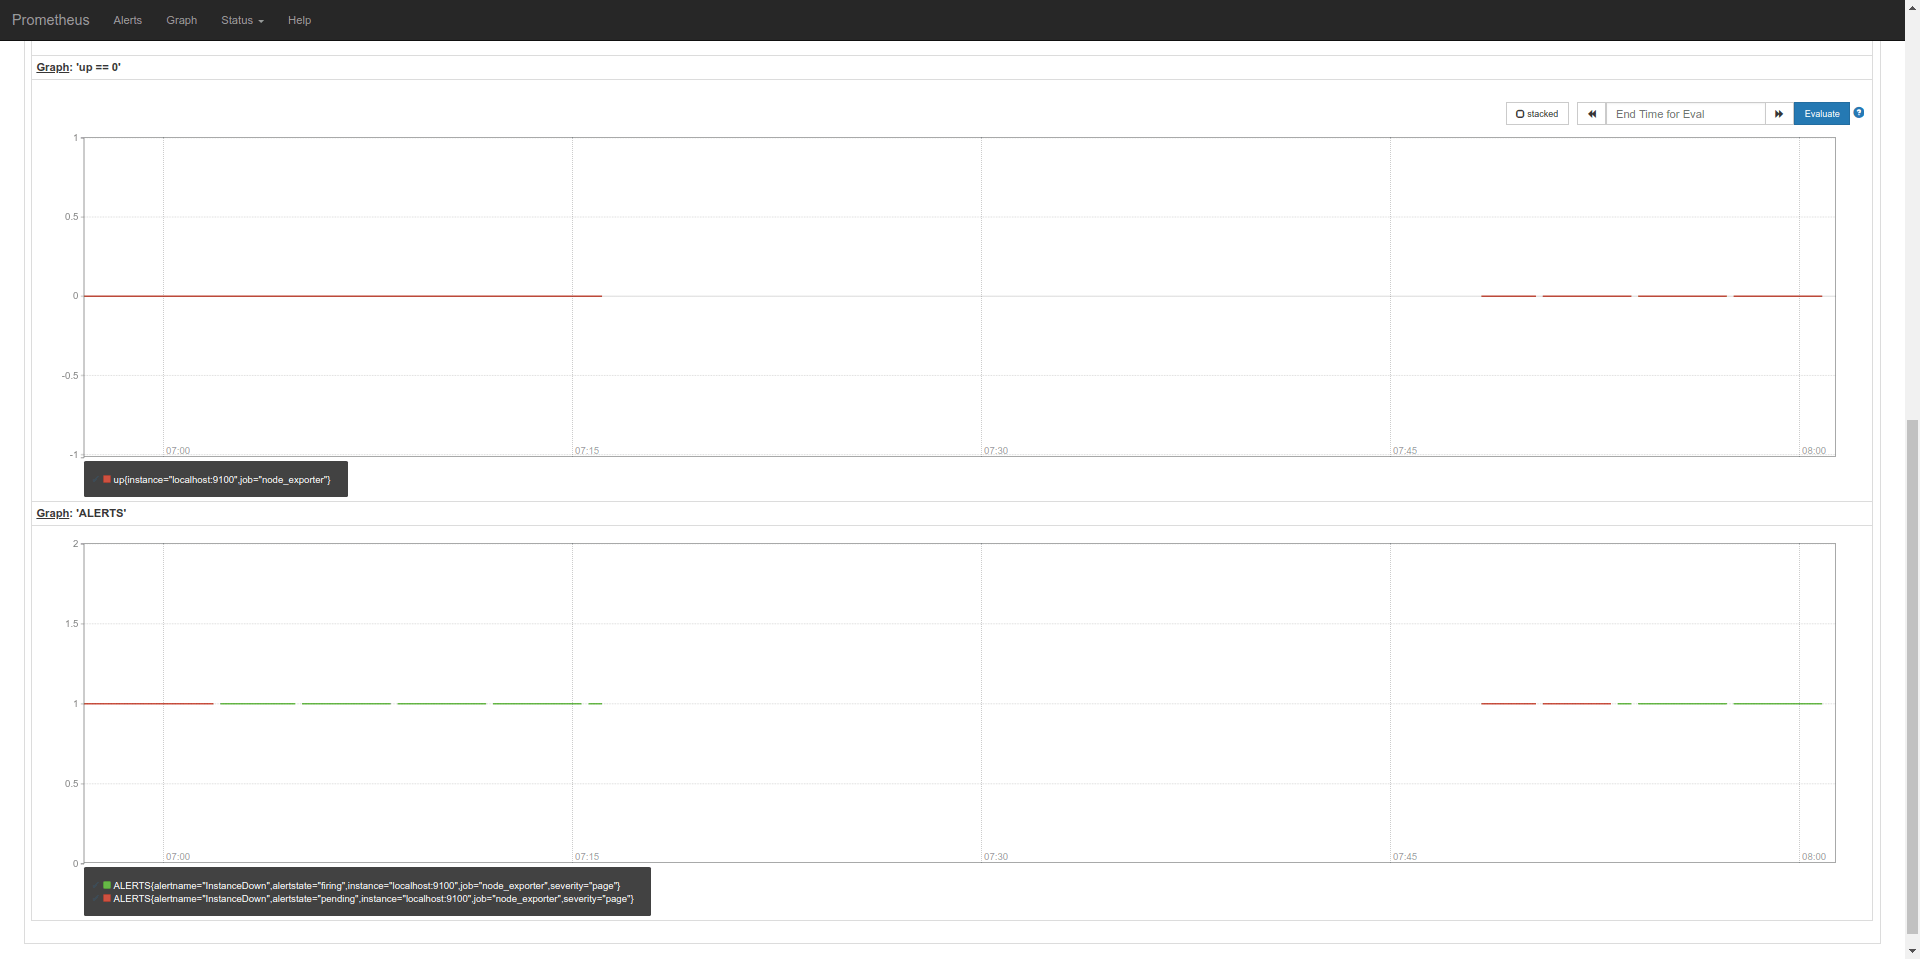
If it was a success, you will see the graphs for the alert expression and ALERT series simulated over the existing data. Graphs are plotted only for the active alerts.
Example
A simple alerting rule, and hit Execute!
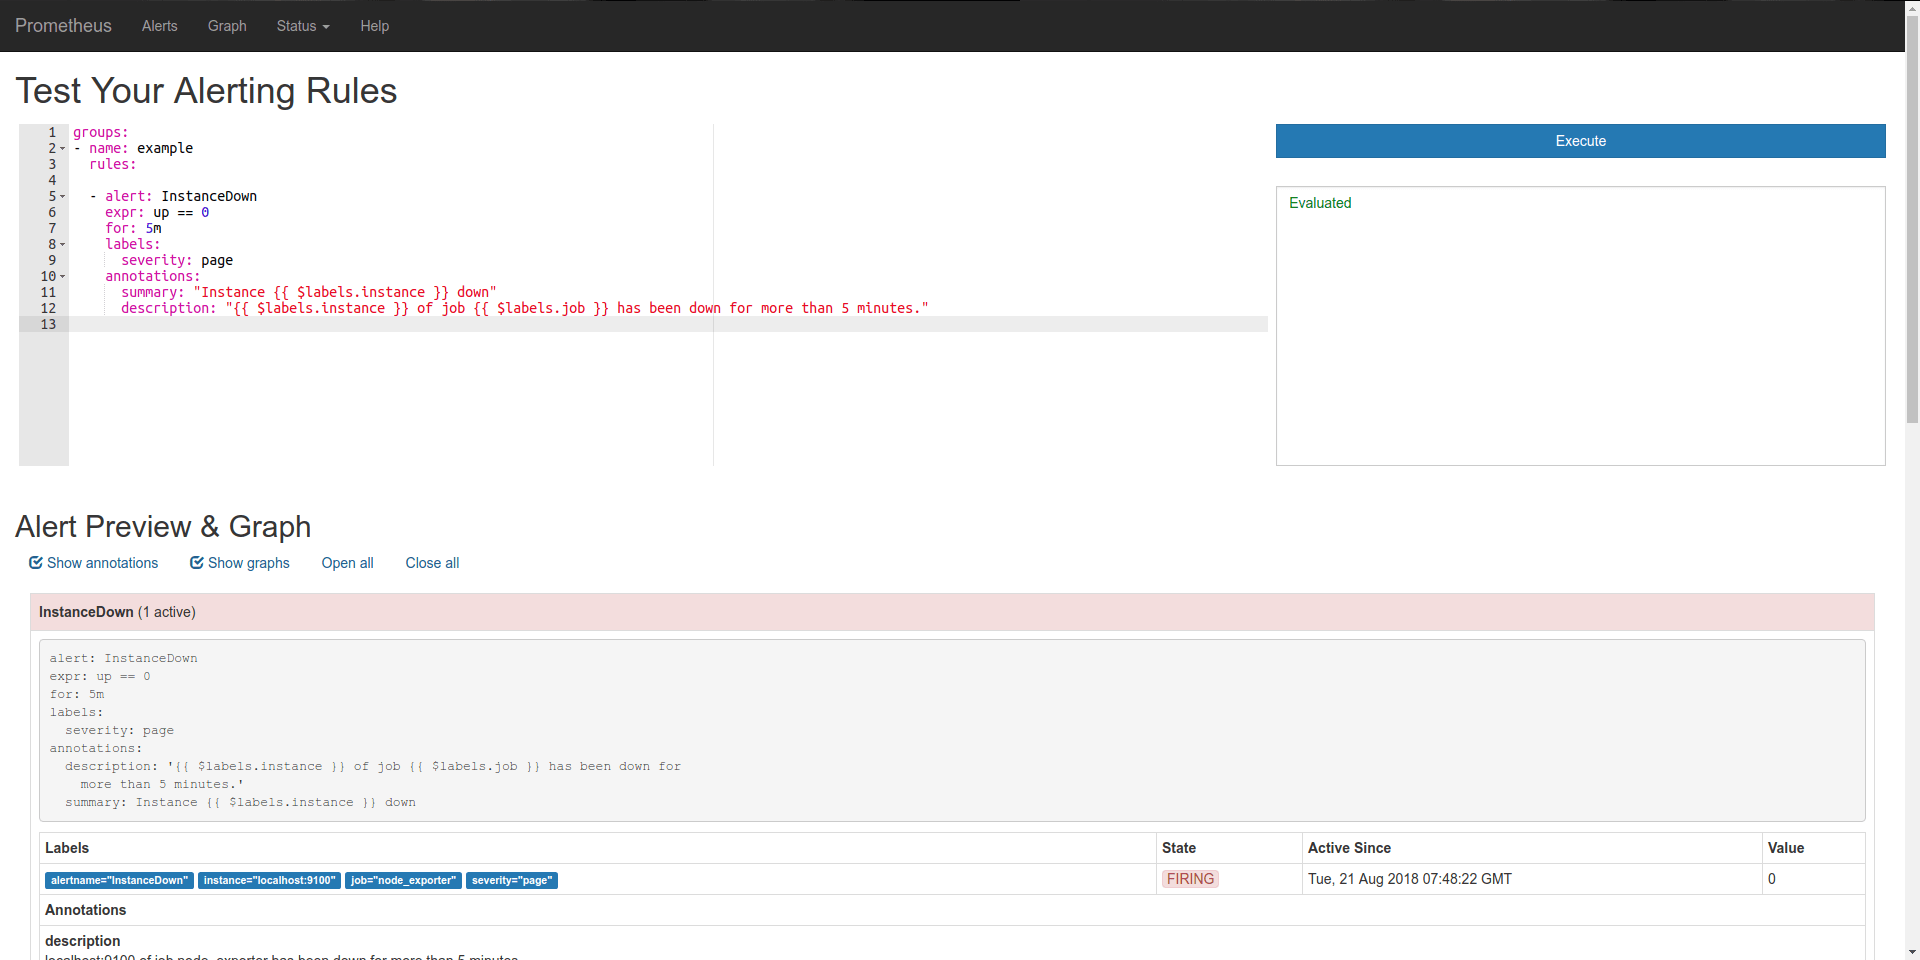
There is 1 active alert, you can see it's info here.
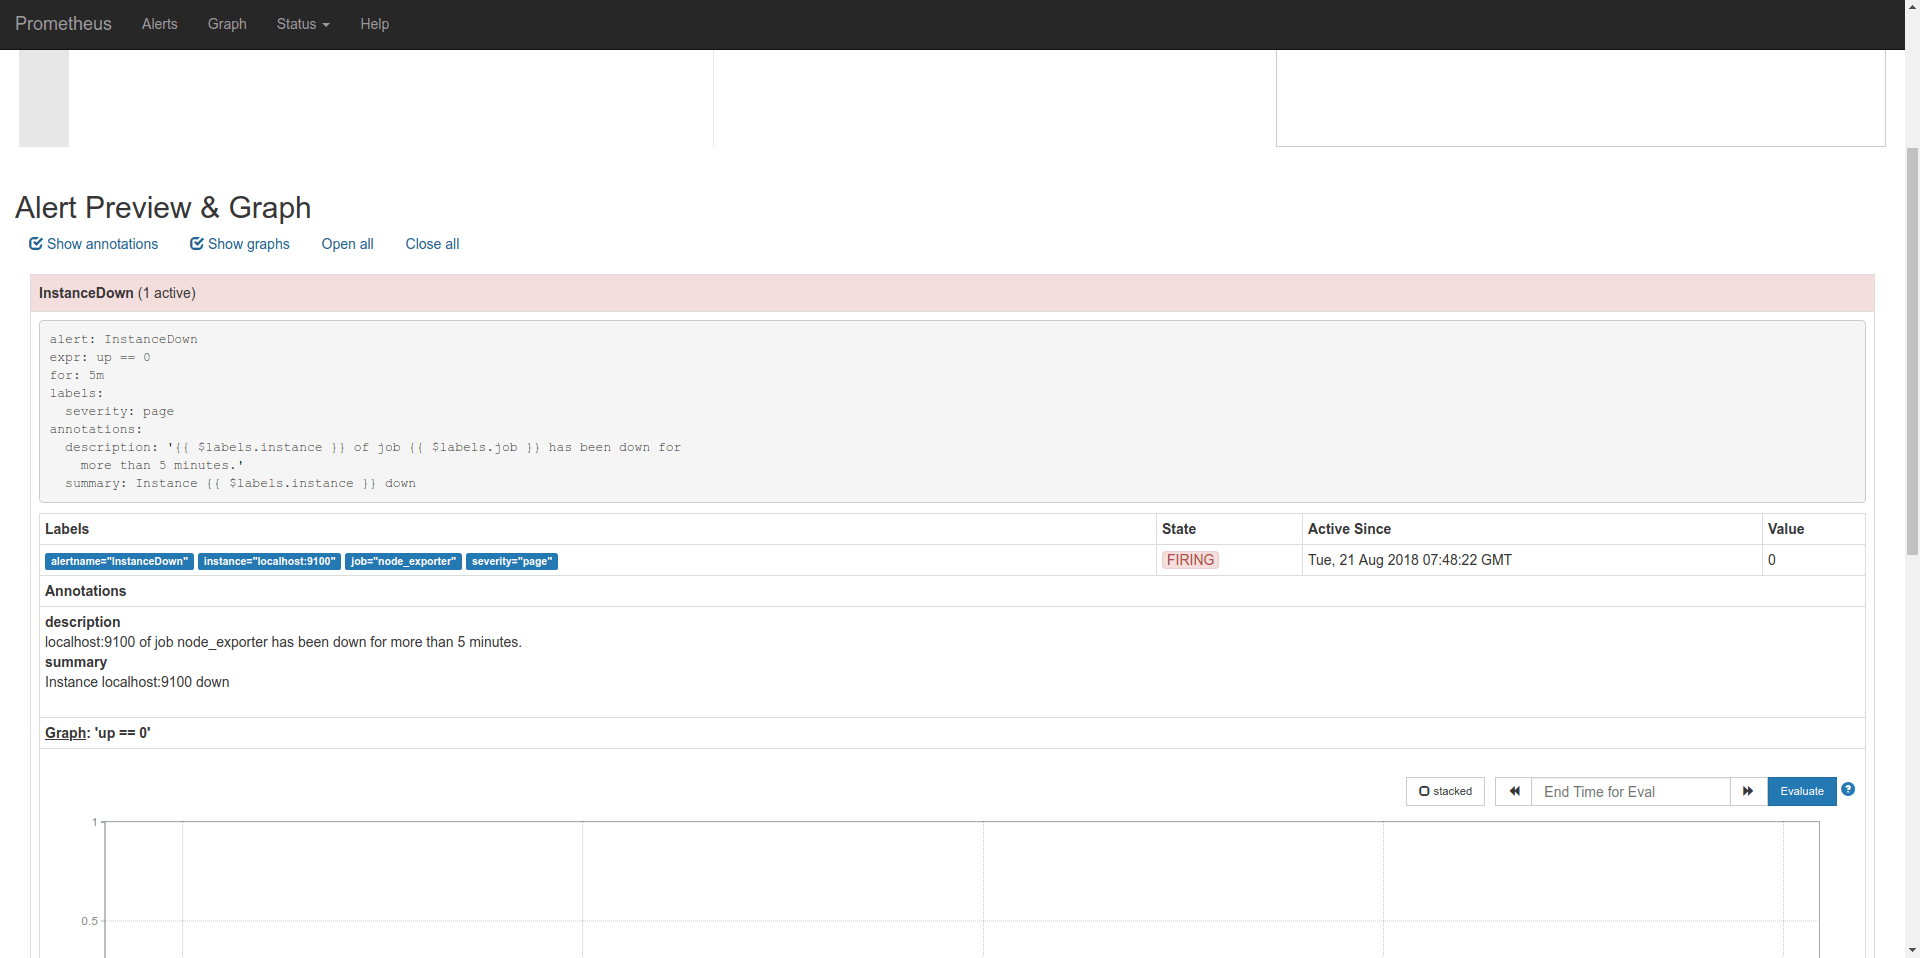
Graph of the expression and the corresponding ALERT graph. You can see that the alerting rule would save switched between pending and firing state twice in the current data.
Example for errors
Error in expr.
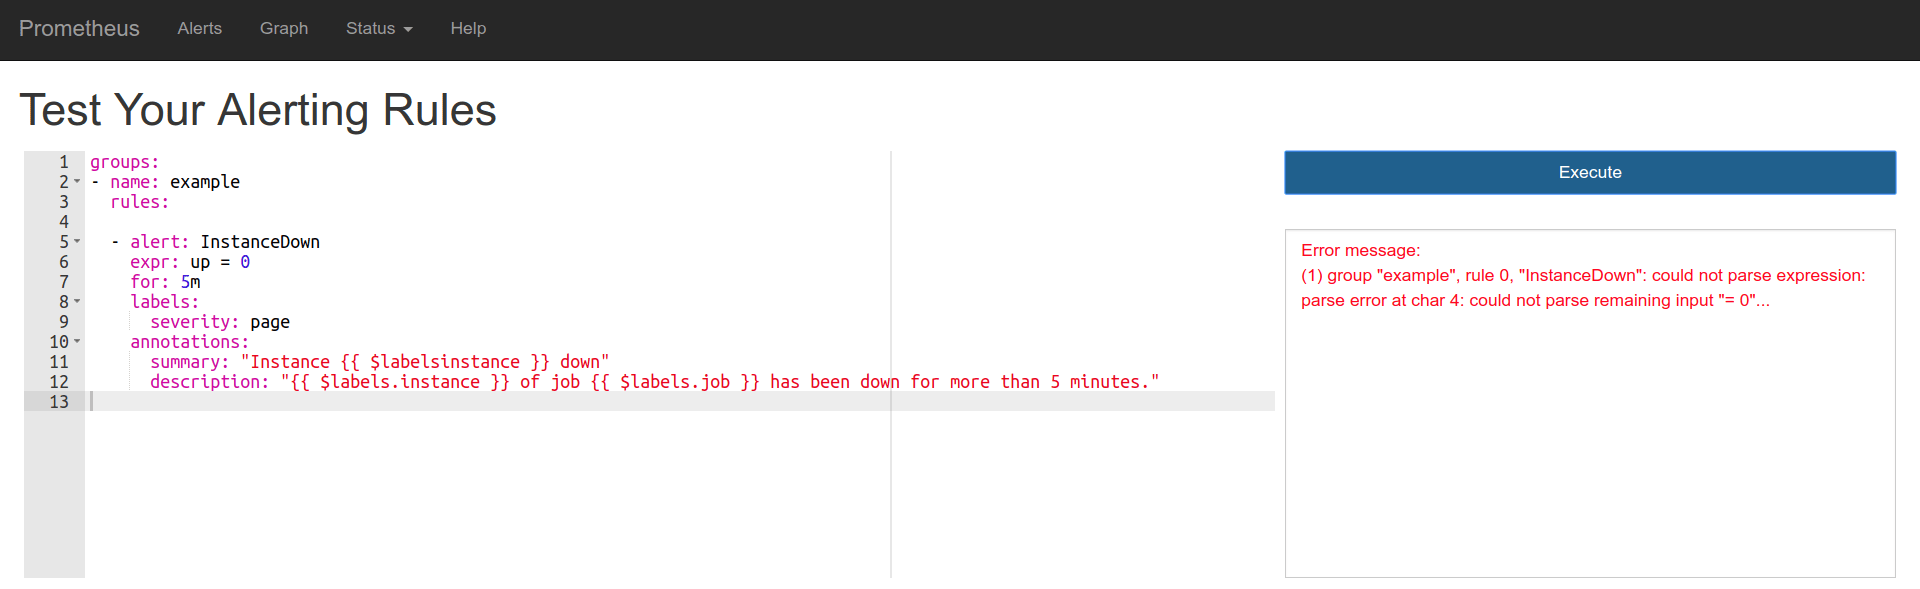
Error in template variables.
Stay tuned, it will be added to Prometheus soon!